svend3 chart library
Svelte x D3 "plug and play" charting library

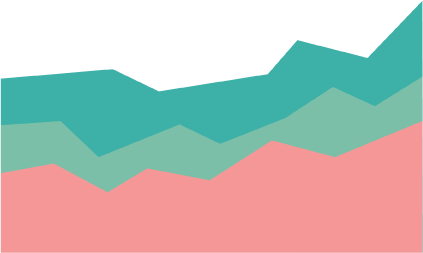
Area Chart

Area Chart

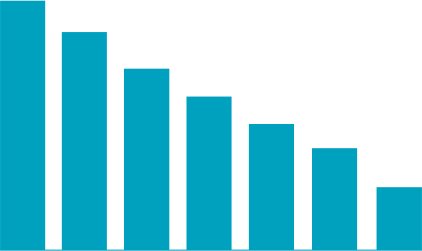
Bar Chart

Bar Chart

Bubble Chart

Bubble Chart

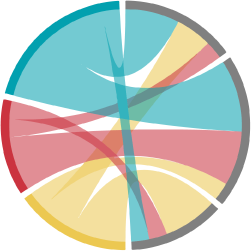
Chord Diagram

Chord Diagram

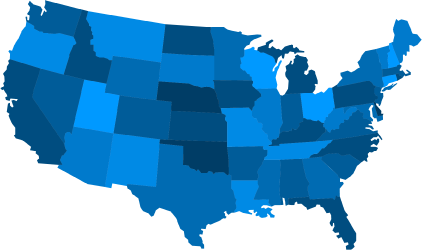
Choropleth

Choropleth

Circle Packing

Circle Packing

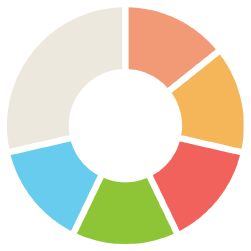
Donut Chart

Donut Chart

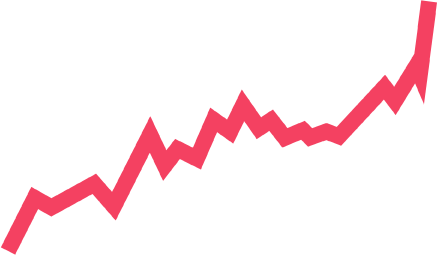
Line Chart

Line Chart

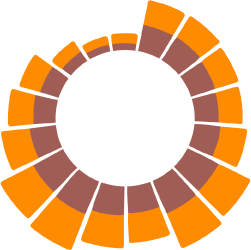
Radial Stacked Bar Chart

Radial Stacked Bar Chart

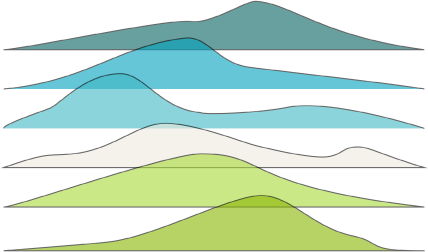
Ridgeline Plot

Ridgeline Plot

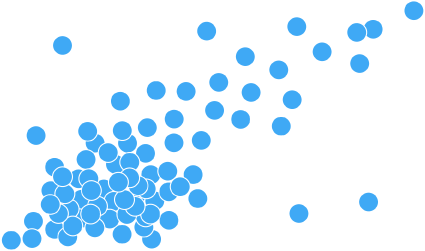
Scatterplot

Scatterplot

Pie Chart

Pie Chart

Quickstart Guide

Svend3r is an open source charting library for Svelte with easy-to-use modular components. Svend3r provides beautiful visualizations that harness the power of D3 to bring your data to life while abstracting away its imperative-style code. With Svend3r, you can easily adjust the charts to look exactly the way you want while taking advantage of Svelte's optimized DOM interaction.

New to Svelte and D3? If you use npm,
npm install svelte and npm install d3.

Exporting a Chart Component

When we say Svend3r is "plug and play," we mean it!

  • Navigate to a chart page
  • Review the data schema to ensure conformity of your data set
  • Update the adjustable properties to suit your style
  • Create a new svelte component file (and js data file) in your project directory
  • Paste code from the Code tab directly into your svelte file
  • Update the data import to match your data file location (or pass it down as a prop)
  • Want to Contribute?

    Want to be a open source contributor? Have a Svelte component chart you'd like to share with the Svelte community, or recommended improvements? Submit a pull request to the contributor branch on GitHub.